


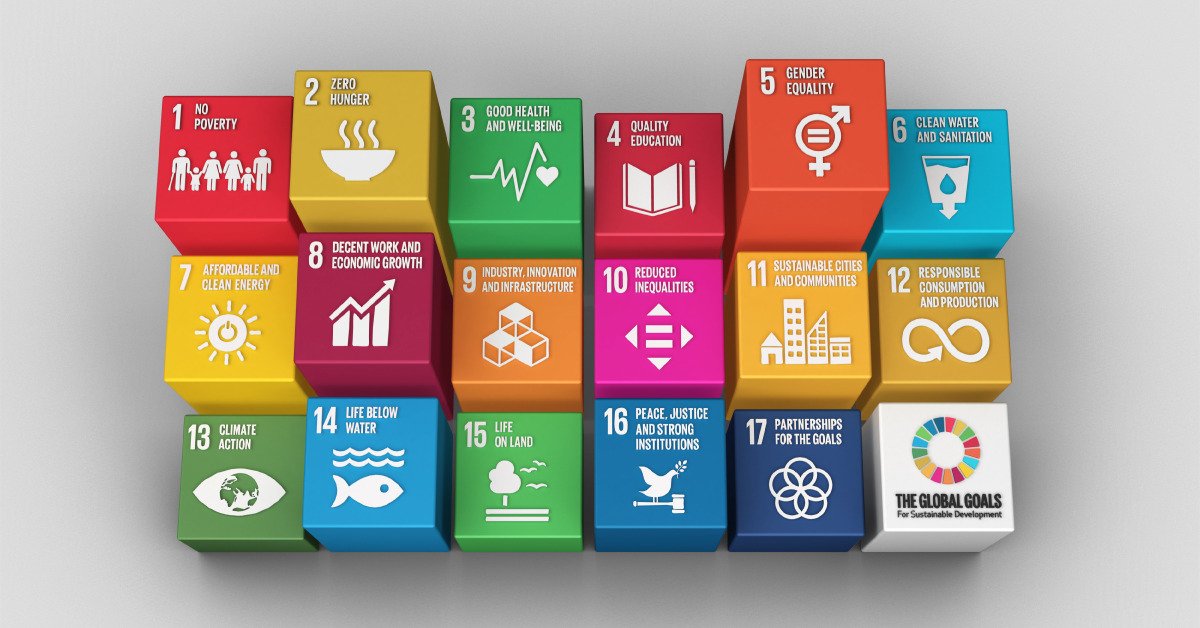
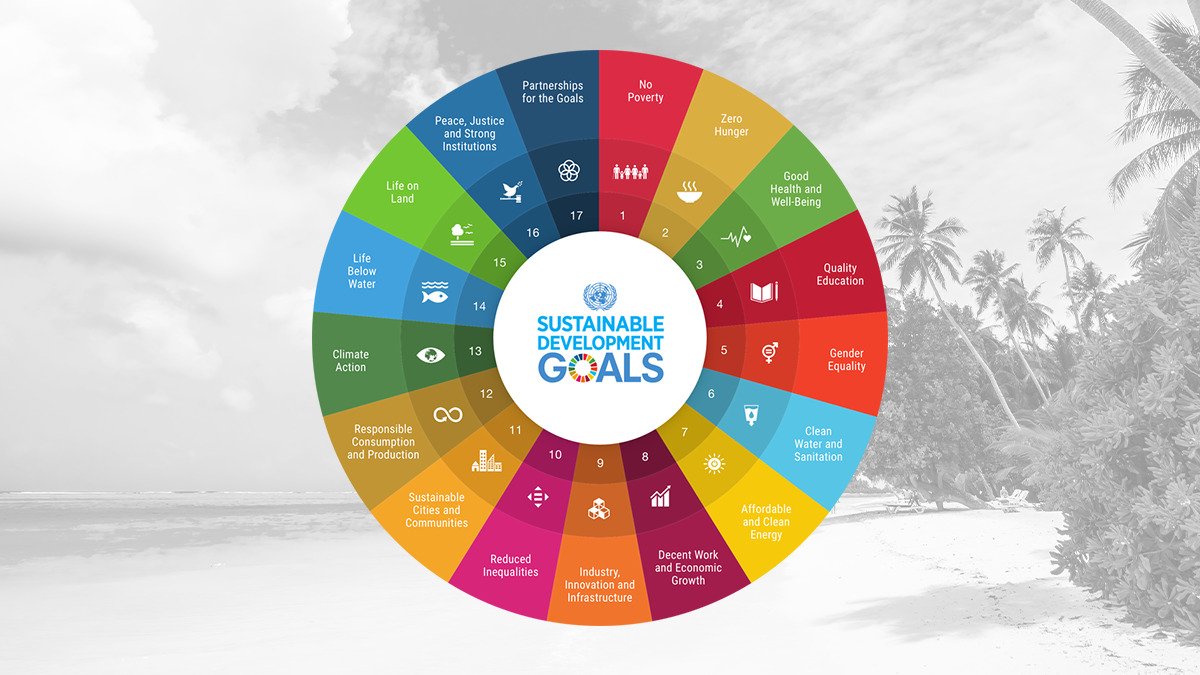
The world we live in presents the classic lopsided growth model where laggard states trail their progressive peers on the Human Development Index (HDI). Just to cite an example, Somalia offers the antithesis to Sweeden on key HDI parameters like health, education, per capita income etc. True, there are glaring disparities but they aren’t to stay here forever. Nations have converged efforts to equalize the world with 17 Sustainable Development Goals (SDGs). These 17 SDGs adopted in 2015 by the UN member nations form the cornerstone of shared prosperity for the other two Ps- people and planet.
With the SDGs acting as the lodestar for UN’s 2030 Agenda for Sustainable Development, global attention has gravitated towards their implementation, monitoring, and evaluation. To make success out of the SDGs, 231 unique SDG indicators have been defined and 169 targets are spread out across 17 Goals. Yet, monitoring and evaluating indicators on the ground is beset with challenges.
What are the roadblocks in tracking indicators?
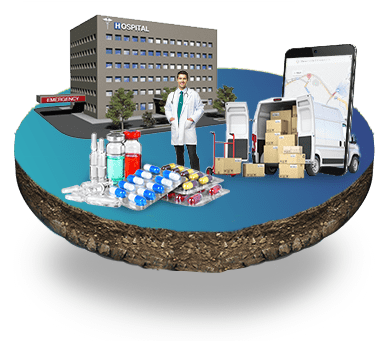
Appraising progress of SDGs is rife with challenges for governments. That’s because differences abound between cities and rural zones on geographical and socio-economic indicators. Owing to these differences, it becomes difficult to select globally applicable and meaningful indicators. Since SDGs are primarily implemented at the local level, it is important to refine city-level indicators. Nations often pursue monitoring and evaluation of SDGs in a disintegrated way. They have a siloed approach to performance monitoring, doing it separately for different disciplines and sectors.
With an expansive list of indicators comes the challenge of complete and effective data collection, particularly at the city-level. One remedy to overcome this challenge is to cross-cutting, multifunctional indicators as they can inform progress on multiple goals or targets by measuring a single data point. The long-term remedy, of course, is on a data revolution or more precisely data presentation revolution to realize the vision of the 2030 Agenda. At all levels of the government, intuitive and communicable data can enhance the transparency and accountability of the entire SDG framework.
The SDG Database & how data can be an enabler
In September 2021, the UN Statistics Division launched the Global SDG Indicators Data Platform. This platform allows users to search and download data on 210 of the 231 global SDG indicators and provides access to SDG profiles for 132 countries. Action on SDG monitoring has gained traction after the UN World Data Forum, held in October 2021 in Bern, Switzerland. The conference ended with the adoption of the Bern Data Compact for the Decade of Action on SDGs.
The thrust is on use of community driven data in official processes rooted in the Leave No One Behind (LNOB) Partnership, a growing international civil society data collaboration for inclusivity in SDG data. Using findings from its recent survey on social services in Kenya, the LNOB Coalition has initiated a dialogue with national statistical authorities about the impact of data gaps in targeting services. The LNOB Coalition launched a flagship project called 100 Hotspots in India, which the UN has recognized as a good practice for the SDGs.
Odisha SDG Dashboard- Data at play for goal mapping
NITI Aayog, the Government of India (GoI) planning think tank has constructed the SDG India Index, spanning 13 out of 17 SDGs. The Index tracks the progress of all the States and Union Territories (UTs) on a set of 62 National Indicators, measuring their progress on the outcomes of the interventions and schemes of GoI. Taking the cue, the Government of Odisha has come out with the first defined State Indicator Framework. The state is also going a step ahead to refine it with a District Indicator Framework.
CSM Technologies has developed an intuitive SDG dashboard. Driven by analytics, it serves as a tool for monitoring the SDG goals and the respective indicators at state, and district level. Also, it enables the state machinery to identifying the areas of strength and weakness, thus facilitating development of implementation strategies and allocation of resources. What’s more, it helps to measure progress towards achieving the targets defined as per framework.
The dashboard has been designed for analysis at three levels:
- Current status analysis: The current performance can be analyzed to the granularity of indicators from the state and district level.
- Trend analysis: Analysis to monitor the progress over a period of time.
- Forecasting: Analysis can be done at two levels- time taken to reach the targets at current pace of progress and desired rate of progress needed to reach the target from the current status in a given time frame.
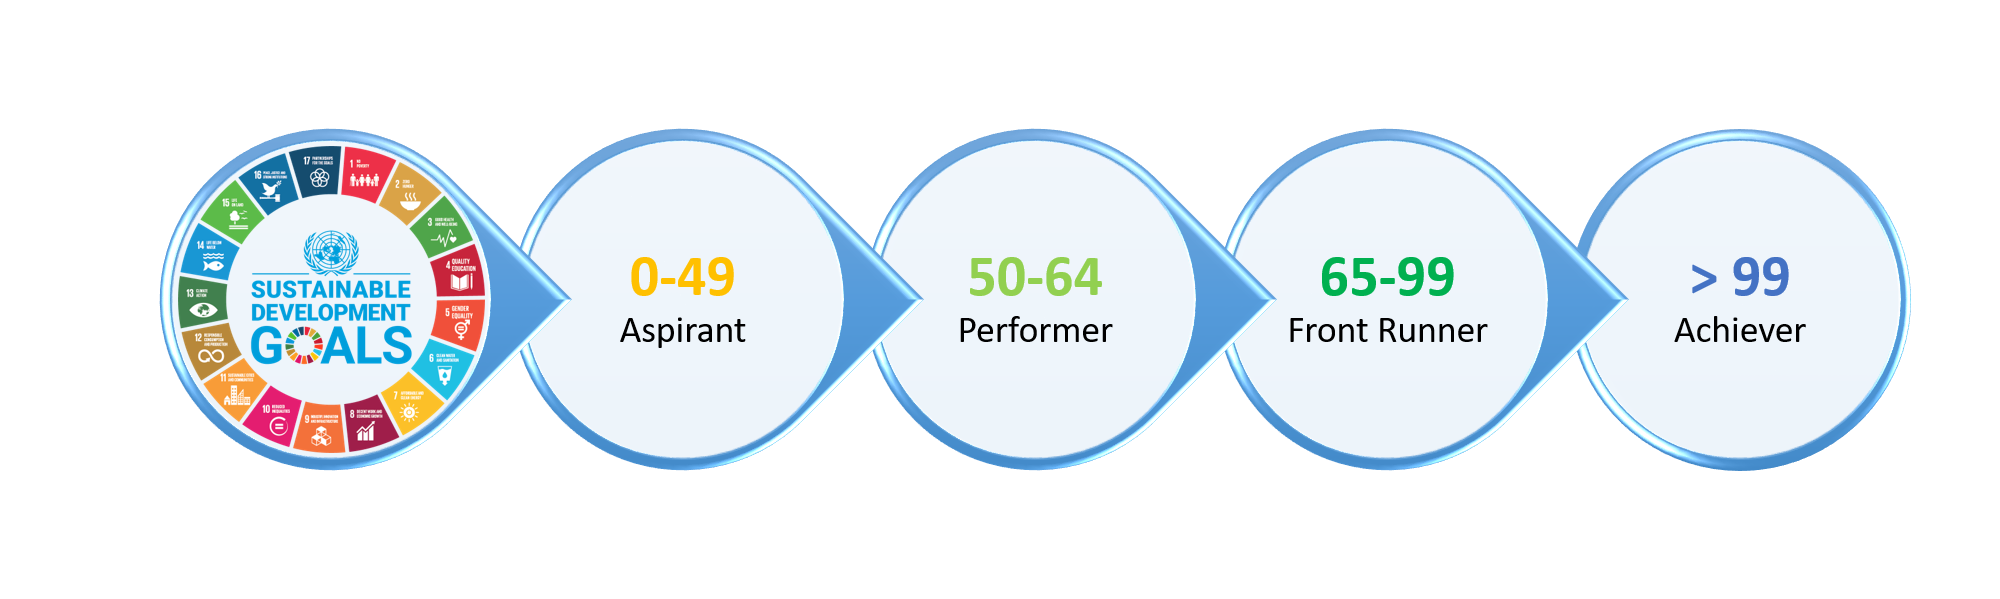
Depending on the composite score, the district is classified as Aspirant (0-49), Performer (50-64), Front Runner (65-99) or Achiever (More than 99).
In the future as the data revolution matures, technologies like satellite images, drones, and data modelling can be tapped to unlock insights from high quality environmental and geographical data. When communicated right and applied by decision makers, this data can be the springboard for definitive action on SDGs.


Recent Publications


- Agriculture and Allied Services
- AgriTech
- Application Development
- Artificial Intelligence
- Blockchain
- COVID-19
- CSM Editorial
- Data Analytics
- Digital service
- Digital Transformation
- Education
- EduTech
- Emerging Technologies
- Enterprise Resource Planning
- Food Security
- Golden Records
- GovTech Solution
- Green Jobs
- Healthcare
- HR Analytics
- Hybrid Work Culture
- Independence Thought
- Industry 4.0
- Innovation
- IT Consulting
- Land & Industry
- Life@CSM
- Memory Lane
- Mines & Minerals
- Mining Technology
- Opinion Piece
- Precision Agriculture
- Smart City
- Social Listening
- Social Media
- Social Registry
- Super Apps
- Tourism
- User Experience
- Web 3.0
- Work Culture


We will verify and publish your comment soon.