


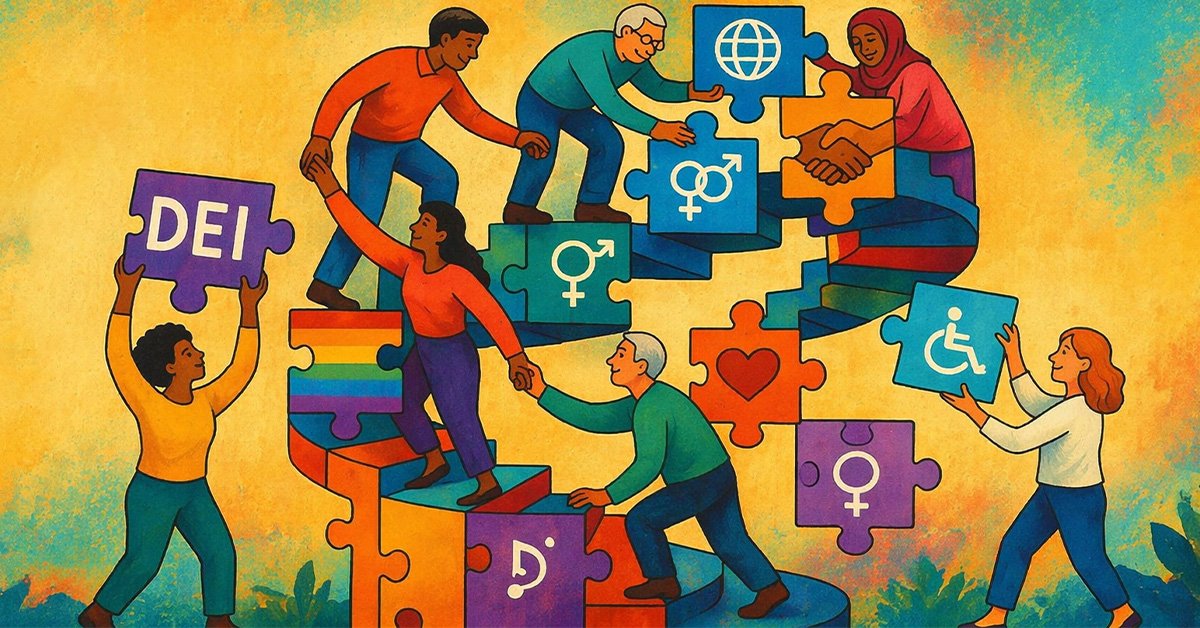
Imagine governing a state without a compass. You would be navigating blind, making decisions based on instinct rather than evidence. This is precisely the challenge that SDG Dashboards solve for governments, they serve as the GPS for sustainable development, guiding policymakers through data-driven insights towards the ambitious 2030 SDG targets.
The Data Revolution in Indian Governance
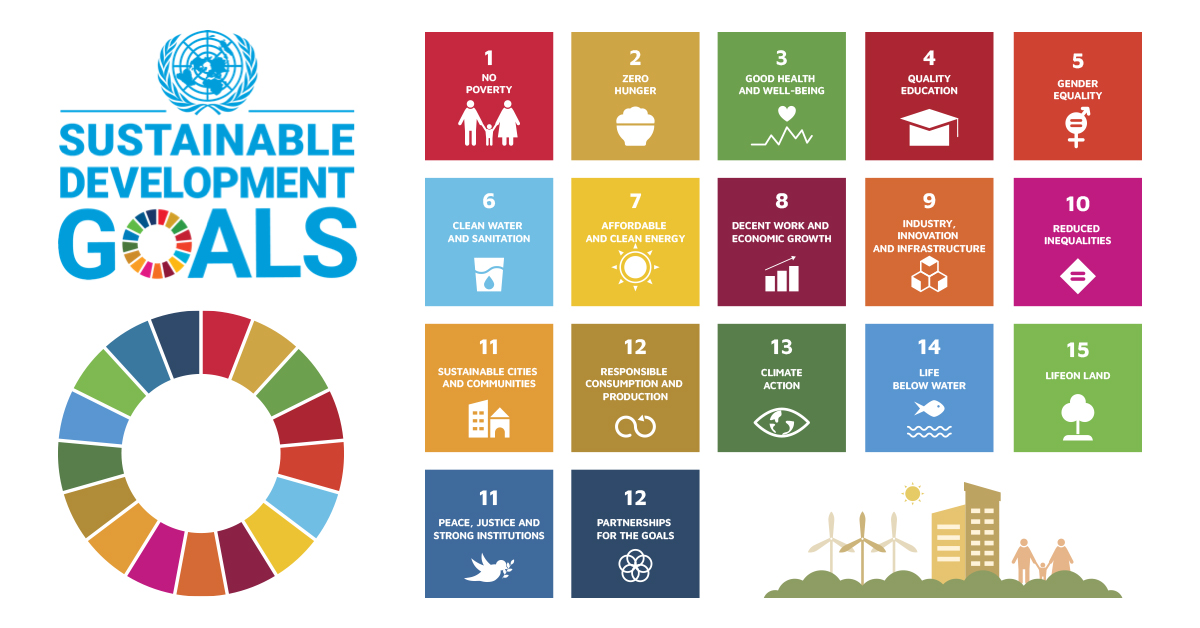
India's journey from a composite SDG score of 57 in 2018 to 71 in 2023-24 tells a remarkable story of progress powered by evidence-based policymaking. The SDG India Index, developed by NITI Aayog, has evolved from tracking 62 indicators across 39 targets to monitoring 113 indicators across 17 SDGs - a testament to the growing sophistication of data-driven governance.
But here's the critical insight: numbers don't lie, but they also don't act alone. When Chhattisgarh launched its SDG Dashboard in February 2023, it wasn't just creating another data repository, it was building a lighthouse for its 28 districts to navigate towards sustainable development. Dhamtari's top ranking with score of 72 didn't happen by chance; it emerged from targeted interventions guided by granular, district-level data.
Why SDG Dashboards Matter
1. From Guesswork to Groundwork
Policymaking often risks becoming an echo chamber of assumptions. SDG Dashboards disrupt that pattern. For instance, the SDG India Index 2023–24 evaluated states using 113 indicators, helping policymakers understand exactly which goals they are falling short on. Bihar’s lag on gender equality or Tamil Nadu’s leadership in maternal health becomes a call to action - not just a statistic.
2. Local Insight, Global Alignment
State-level dashboards like Chhattisgarh’s offer a granular look at district-wise performance across 82 indicators. This localized data allows collectors and planning officials to zero in on underperforming blocks - say, districts with low school enrolment or inadequate sanitation and act decisively. These dashboards bridge the local-global policy divide, making sustainable development a bottom-up process.
3. Competitive Federalism 2.0
SDG rankings are sparking healthy competition among states. Much like how league tables push universities to improve, the SDG India Index nudges states to emulate top performers. Kerala, Uttarakhand, and Himachal Pradesh have consistently ranked high, and this visibility drives other states to adopt similar strategies in education, health, and environment.
4. Accountability on Display
By making data public, dashboards democratize development. Citizens, journalists, and civil society can hold governments accountable for their promises. In a way, SDG dashboards are turning governance into a transparent scoreboard - where performance is visible and inertia is exposed.
Beyond Numbers: The Human Impact
The real power of SDG Dashboards lies not in their technical sophistication but in their ability to translate complex data into actionable policy. When the Jal Jeevan Mission connected 14.9 crore households to tap water, or when PM Ujjwala provided 10 crore LPG connections, these weren't random policy decisions—they were interventions guided by SDG indicators highlighting gaps in basic services.
Think of SDG Dashboards as the MRI scan of governance - they reveal what's happening beneath the surface, identifying growth bottlenecks before they become crises. In Chhattisgarh, district collectors use dashboard rankings as "guiding lights" to achieve 2030 targets, transforming abstract global goals into concrete local action.
Challenges and Considerations
Despite their promise, SDG Dashboards face challenges:
Data Manipulation: Pressure to report optimistic trends, as seen in tools like Poshan Tracker, risks undermining credibility.
Connectivity Issues: Rural internet gaps can delay updates, hindering real-time monitoring.
User-Friendliness: Complex indicators may confuse local officials, requiring simpler interfaces and training.
Data Validation: Accuracy is critical, with solutions like GIS-tagging being explored.
These hurdles are not insurmountable. With ongoing refinements, such as NITI Aayog’s management of over 45 dashboards by 2023, their effectiveness continues to grow.

Decode. Diagnose. Deliver: CSM’s SDG Dashboard Is the State’s New Power Tool
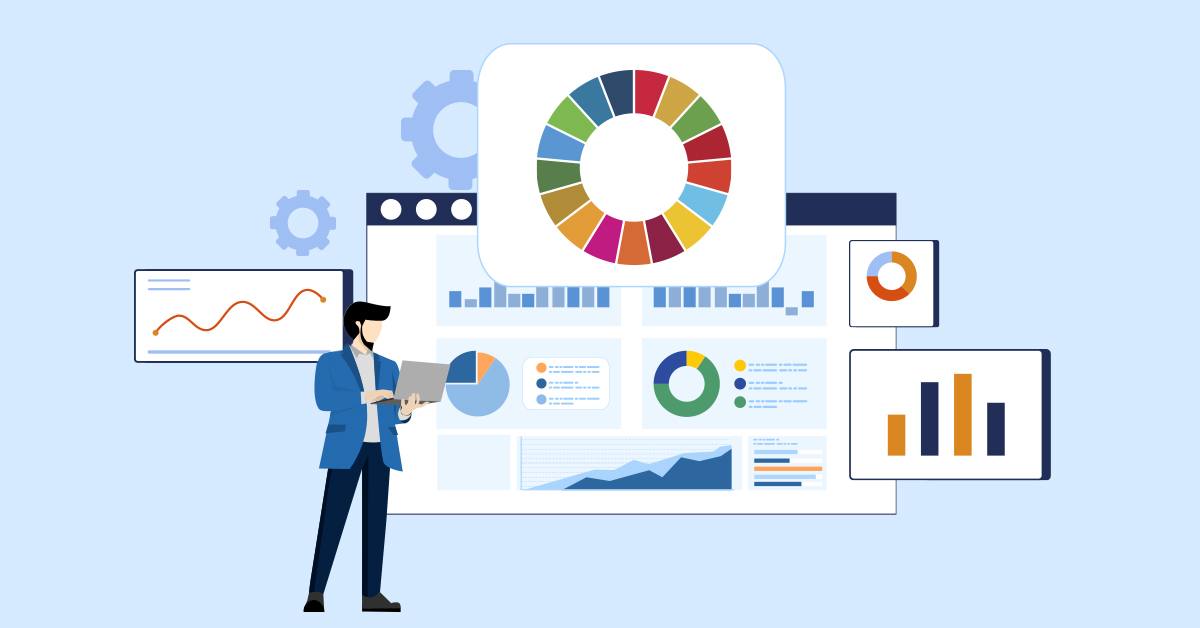
At CSM Tech, we believe that data is the compass guiding good governance. Our state-of-the-art SDG Dashboard, implemented for the Government of Odisha, stands as a testament to our capabilities in building data-driven, outcome-focused governance tools. This intuitive platform empowers state governments to monitor, analyze, and forecast progress across all 17 SDGs—right down to the block level.
What makes our dashboard a game-changer is its ability to translate complex data into actionable insights. It classifies districts into Aspirant, Performer, Front Runner, and Achiever categories, enabling laser-sharp policy interventions and optimal resource allocation. Governments can track performance over time, understand gaps, and predict future trends - all in one unified interface.
In a federal setup like India’s, where developmental needs vary drastically across regions, such a dashboard isn’t just useful—it’s essential. It ensures transparency, accountability, and above all, strategic governance.
As a proud UN Global Compact member, CSM Tech’s solutions are future-ready, poised to integrate satellite imagery, drone tech, and data modelling for even deeper impact. Our SDG dashboard isn't just a tool, it's a catalyst for sustainable transformation.
When AI Meets SDGs: The Future of Governance Is Already Here
Imagine a future where every state has an AI-powered SDG dashboard that not only tracks progress but also recommends policy interventions based on predictive analytics. A future where dashboards sync seamlessly with real-time databases - from PM Awas Yojana to Jal Jeevan Mission to reflect grassroots-level impact. A future where a district collector in Dantewada or Dimapur uses the same dashboard logic as a policymaker in Delhi or Geneva.
That future isn’t far-fetched. It’s already being tested in states like Chhattisgarh, where dashboard data drives district-level committees, aligns development spending, and shapes on-ground interventions.
SDG dashboards aren’t just tools - they’re a mindset. One that places evidence over ideology, data over declarations, and outcomes over optics.
And in India’s race to 2030, this mindset might just be the game-changer.


Recent Publications


- Agriculture and Allied Services
- AgriTech
- Application Development
- Artificial Intelligence
- Blockchain
- COVID-19
- CSM Editorial
- Data Analytics
- Digital service
- Digital Transformation
- Education
- EduTech
- Emerging Technologies
- Enterprise Resource Planning
- Food Security
- Golden Records
- GovTech Solution
- Green Jobs
- Healthcare
- HR Analytics
- Hybrid Work Culture
- Independence Thought
- Industry 4.0
- Innovation
- IT Consulting
- Land & Industry
- Life@CSM
- Memory Lane
- Mines & Minerals
- Mining Technology
- Opinion Piece
- Precision Agriculture
- Smart City
- Social Listening
- Social Media
- Social Registry
- Super Apps
- Tourism
- User Experience
- Web 3.0
- Work Culture


We will verify and publish your comment soon.